
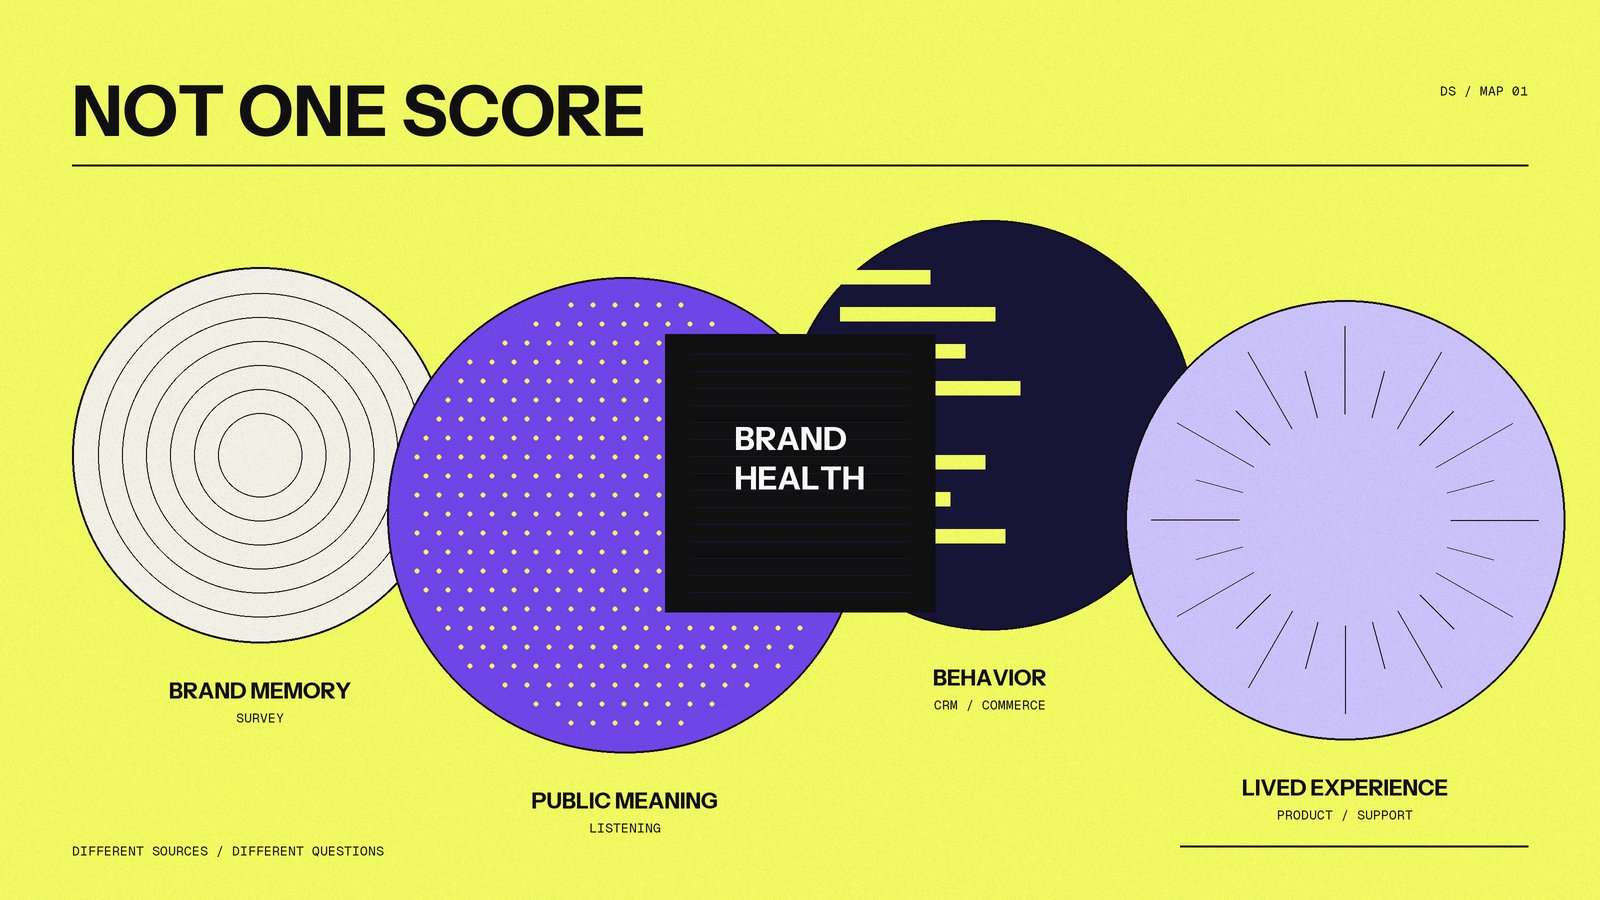
The quarterly brand-health deck is green. Awareness is stable, positive conversation is up, and share of voice has improved. At the same time, branded search is flat, support is hearing the same setup complaint, and repeat purchase has slipped.
Which number describes the health of the brand?
None of them on its own.
Brand health metrics are a measurement system, not a single score. A useful system connects four different questions: Do people know and consider us? What are they saying in public? What are they doing? What happens after they buy? Surveys, search, social listening, sales, CRM, product, and support data each answer a different part of that system.
This article is for consumer-insights and brand-strategy leads who own a recurring brand-health review. It shows where social listening is useful, where it is not, and how to build a scorecard that does not ask one source to represent the whole market.
Start with the decision, not the dashboard
A brand-health review should help someone decide whether to protect, investigate, invest, or wait. Before choosing metrics, write down the decision and the change that would alter it.
For example:
We need to decide whether a fall in consideration is a broad brand problem, a product-specific ownership problem, or temporary campaign noise.
That sentence immediately requires more than a social dashboard. It needs a stable measure of consideration, public evidence about what people associate with the brand, behavioral data showing whether demand changed, and experience data showing whether an issue repeats among customers.
Use the following map to assign each question to the source that can answer it most directly.
Brand-health question | Primary evidence | Useful metrics | What it can support |
|---|---|---|---|
Do people remember and consider us? | Representative or well-designed tracking surveys | Aided and unaided awareness, salience, familiarity, consideration, purchase intent | Whether brand memory or stated preference changed in the measured audience |
Are people actively looking for us? | Search and owned web analytics | Branded search demand, direct visits, product-page engagement | Whether observable demand behavior moved, not why it moved |
What meaning is forming around the brand? | Public posts, comments, communities, reviews, creator content | Conversation volume, share of voice, recurring themes, source concentration, sentiment with context | Which associations, questions, comparisons, and risks deserve investigation |
Are people choosing and staying? | Commerce, CRM, subscription, and retention data | Conversion, repeat purchase, churn, win/loss, cohort retention | What customers actually did in the business system |
What happens after purchase? | Support, returns, warranty, product telemetry, reviews | Contact rate, return reasons, defect or issue incidence, time to resolution, repeat complaints | Whether an ownership problem is isolated, recurring, or operationally costly |
This is not a demand for one enormous dashboard. It is a rule for interpretation: every headline must name the evidence layer behind it.
Survey-based Brand Lift illustrates the distinction. Google measures outcomes such as awareness, consideration, and brand association by comparing survey responses from exposed and baseline groups; it does not substitute impressions or clicks for those perception metrics. Qualtrics’ brand-tracking guidance likewise separates awareness, consideration, purchase intent, perception, and customer effort, then recommends enriching the tracker with search, sales, media, and social data. The practical lesson is simple: different sources are meant to be combined, not collapsed into one label.
Track seven metrics, but keep their evidence layers visible
The exact scorecard depends on the category and decision. Most consumer brands can begin with seven metric groups.
Metric group | Suggested measure | Required context | Review cadence |
|---|---|---|---|
Awareness and salience | Aided/unaided awareness; top-of-mind recall | Audience, market, sample, question wording | Monthly or quarterly |
Consideration | Brand considered for the next relevant purchase | Category, audience, competitor set, confidence interval | Monthly or quarterly |
Observable demand | Branded search, direct visits, qualified product-page sessions | Seasonality, campaign timing, channel mix | Weekly with monthly trend review |
Public conversation | Relevant mentions and share of voice | Query, platform set, language, parent-post count, denominator | Weekly |
Brand associations | Recurring needs, comparisons, objections, recommendation language | Independent-source count, buyer stage, product version | Weekly or monthly |
Customer behavior | Conversion, repeat purchase, churn, win/loss | Cohort, market, product, channel | Weekly or monthly |
Ownership experience | Support rate, return reason, issue incidence, resolution time | Orders or active customers as denominator | Weekly or monthly |
Do not average these seven groups into a single number unless the weighting and decision rule are explicit. A two-point change in awareness and a two-point change in return rate are not interchangeable. One measures memory in a sampled audience; the other measures customer outcomes in an operational denominator.
The scorecard should therefore display three things beside every value:
- The denominator: survey respondents, relevant public items, orders, active customers, or sessions;
- The boundary: market, audience, platform, language, product, and time window;
- The owner: the team that can verify or act on the change.
What social listening contributes to brand health
Social listening is strongest when the review needs context before the next survey wave or business report arrives. It can show:
- where a conversation is growing and which platform drives the change;
- which product, use case, competitor, or claim people attach to the brand;
- which buyer questions, objections, and ownership problems repeat across independent sources;
- whether a change is distributed or concentrated in one creator, thread, or parent post;
- the original public evidence behind a theme, so product, support, or marketing can check the claim.
Those capabilities make public conversation a useful diagnostic layer. A fall in consideration may coincide with a new comparison theme. A rise in branded search may coincide with a launch, creator review, or controversy. A support issue may first appear in owner communities before it reaches a formal ticket threshold.
Social listening can help the team form and prioritize those explanations. It cannot prove that the explanation caused the survey, search, or sales movement.
What social listening cannot establish by itself
A public-conversation sample is self-selected: people decide whether to post, comment, or review. Platform coverage also changes the buying moment represented by the data. A YouTube-heavy sample may be rich in reviews and purchase evaluation; an owner forum may surface long-term compatibility and support; neither is automatically representative of everyone who knows, considers, buys, or uses the brand.
Social listening alone cannot establish:
- population-level awareness or consideration;
- the percentage of all customers who experienced an issue;
- conversion, repeat purchase, churn, or customer lifetime value;
- causal lift from a campaign;
- whether silent customers agree with the people who posted;
- a market-wide reputation score when the sample is concentrated in one platform or language.
The correct response is not to discard public evidence. It is to match the claim to the sample, then request the missing evidence before escalating the decision.

Bambu Lab: two DataScaler views, two different jobs
DataScaler’s frozen Bambu Lab study shows why a measurement boundary belongs inside the finding, not in a footnote.
The 90-day dataset contains 655 source posts and 18,357 post-and-comment mentions from YouTube, Instagram, and X. YouTube supplied 17,511 mentions, or 95.4% of the displayed sample.
Observation | Valid brand-health use | Invalid conclusion | Missing evidence |
|---|---|---|---|
95.4% of displayed mentions came from YouTube | Investigate review, comparison, tutorial, and comment-section purchase questions | “95.4% of the whole market talks about Bambu Lab on YouTube” | Balanced platform coverage and a defined market population |
Product and comparison themes appear repeatedly | Identify questions for content, product marketing, and source review | “These themes determine purchase for all buyers” | Survey, search, conversion, or win/loss evidence |
Positive and negative theme lists contain overlapping language | Treat words such as reliability as context-dependent and inspect the sources | “Reliability is a positive or negative brand score” | Source-level classification by product, use case, and buyer stage |
This research does not calculate a complete Bambu Lab brand-health score. It does something more defensible: it shows which public signals are visible, which buying context dominates the sample, and which questions should be checked in other systems.
Read the full Bambu Lab social listening research for the frozen scope, HTML data tables, methodology, sources, and limitations.
What the current DataScaler snapshot adds
The fixed study is designed for citation. A live monitoring view is designed to tell a team what to inspect next.
On September 11, 2026, we queried the existing Bambu Lab knowledge space through DataScaler MCP. Its latest completed collection was September 3. The 30-day view, filtered by collection time, contained 159 posts and 164 post-and-comment mentions from YouTube, Instagram, and X. This was a configured monitoring sample using six search terms and one result page per platform—not a census of all brand conversation.
DataScaler signal | What it supports | What it does not prove | Next check |
|---|---|---|---|
118 of 159 analyzed posts were positive (74%); 37 were neutral and 4 negative | Public conversation in this configured sample leaned positive | 74% of all customers feel positive about Bambu Lab | Compare organic and sponsored posts; test the same associations in a stable brand tracker |
“Easy to use” appeared 9 times, “fast printing speed” 6 times, and “multi-color printing” 4 times | These are candidate associations for positioning, creative, and survey questions | These attributes drive purchase for the whole category | Add the phrases to consideration research, search analysis, and message testing |
The four negative posts covered different issues: print automation, overhang quality, shipping damage, and kit-built versus pre-built preference | The posts create a specific investigation queue | A repeated product crisis or issue incidence rate | Check support, return, shipping, product-quality, and win/loss data separately |
YouTube supplied 1.57 million of the 1.63 million measurable reach in the sample | Measurable reach was highly concentrated in YouTube | YouTube owns the same share of total category attention | Resolve missing or non-comparable reach fields before a cross-platform allocation decision |
The source posts change how these numbers should be read. One high-engagement Instagram post explicitly disclosed Bambu Lab sponsorship, so it is evidence of creator-campaign resonance—not independent preference. Meanwhile, the negative set contains a Prusa automation comparison, an Anycubic overhang comparison, and a shipping-damage complaint. Combining them into one “negative sentiment” explanation would hide three different owners and three different follow-up datasets.
This is the practical advantage of source-linked monitoring: the percentage provides orientation; the repeated language suggests a hypothesis; the underlying posts tell the team where to validate it. None of the three should be presented as a complete brand-health score.
Run one review with three levels of evidence
The most useful brand-health meeting is not a tour of every metric. It is a short list of changes that have been assigned the right level of evidence.
Status | Evidence condition | Meeting language | Next action |
|---|---|---|---|
Observe | One source changes, but the movement is small or concentrated | “A possible signal appeared in public conversation” | Keep the scope stable and watch the next period |
Investigate | Two evidence layers move, or independent sources repeat the same question | “The change is visible in public evidence and one other system” | Check the relevant survey cut, product cohort, support issue, or commercial result |
Act | The issue is verified in the system that owns the outcome | “The operational or customer impact is confirmed” | Assign an owner, action, success measure, and review date |
A weekly review can use public conversation, search, support, and behavioral indicators for early detection. Awareness and consideration usually move on a slower survey cadence. Keep the survey measures stable, then use rotating questions or source evidence to investigate what changed between waves.
For a deeper public-conversation scorecard, use the nine social listening metrics. For continuous change detection, use the weekly competitor monitoring system. The Brand Monitoring solution explains how DataScaler keeps public findings connected to their source posts.
Is there one good brand-health score?
No universal score works across categories and decisions. A composite can be useful when its inputs, weights, denominator, and action threshold are explicit. Keep the underlying measures visible so one strong input cannot hide a decline elsewhere.
How often should brand health be measured?
Match cadence to how quickly the source and decision can change. Review public conversation, search, support, and commerce signals weekly; review stable brand-tracking survey measures monthly or quarterly. Use the same scope and definitions when comparing periods.
Map the public signals behind your brand
DataScaler turns public posts, comments, communities, and reviews into a source-linked brand report. It does not replace surveys, sales, CRM, support, or product data. It gives your team a faster way to see which public questions and repeated issues are worth carrying into those systems.
Enter a brand name or website. DataScaler will identify an initial set of competitors and topics, then let you inspect the public sources behind the report.
Sources
- Google Ads Help: About Brand Lift
- Qualtrics: Designing a World-Class Brand Tracking Study
- DataScaler Research: Bambu Lab Social Listening Research
- DataScaler MCP: Bambu Lab 30-day monitoring snapshot, retrieved September 11, 2026; latest completed collection September 3, 2026