
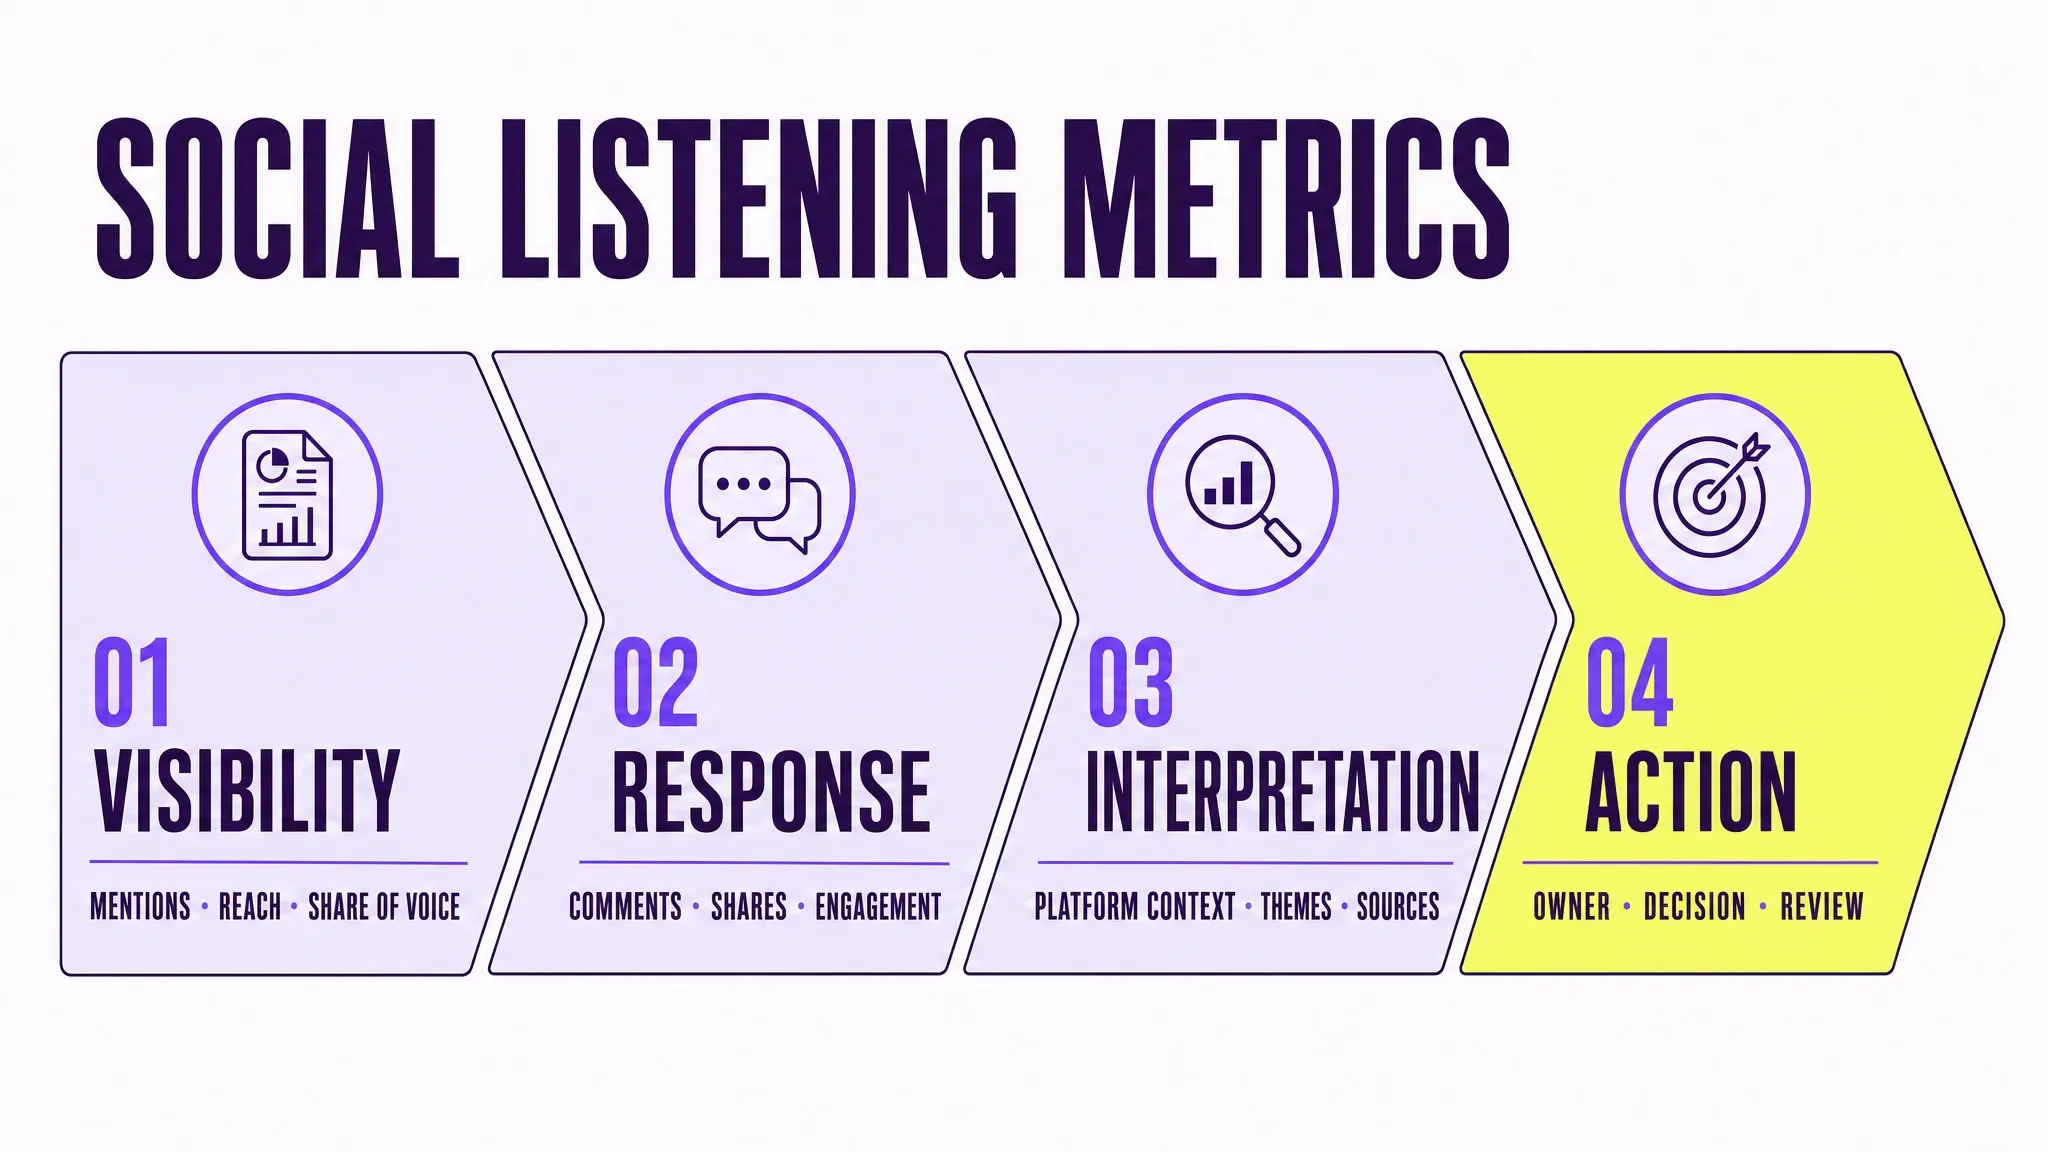
Social listening metrics should help a team understand four things: how visible a brand is, how people respond, what the conversation means, and which finding deserves action. Mentions and sentiment cover only part of that job.
Quick answer
The most useful social listening metrics combine visibility, response, interpretation, and action. Track mention volume, reach, share of voice, engagement, platform-level sentiment, recurring themes, source concentration, and the work assigned after a finding.
The exact metric set depends on the decision. A campaign team needs fast response signals. Product and insights teams need recurring customer language and source evidence. Leadership needs priorities, confidence, and ownership.
What are social listening metrics?
Social listening metrics measure public conversation about a brand, product, competitor, or category. Some describe scale, such as mentions and reach. Others reveal structure, including platform differences and recurring themes. Operational metrics show whether the analysis led to a decision.
A good scorecard starts with the business question. “How did the campaign perform?” needs a different view from “Why are buyers hesitating?” or “Which product issue should we investigate?”
This is also why one blended score rarely works for every team. Marketing, product, support, communications, and leadership can use the same source material while needing different measures and review windows.
How to measure social listening
Measure social listening by starting with one business question, defining a stable data scope, and combining scale metrics with context and action. A campaign report may emphasize mentions and engagement. A product-risk review needs recurring themes, independent sources, severity, and ownership as well.
Use formulas consistently across periods and keep the underlying evidence accessible. The following calculations are useful starting points, not universal standards; platform definitions and available denominators can differ.
Metric | Simple calculation | Read it together with |
|---|---|---|
Mention change |
| Campaigns, incidents, source mix, and query changes |
Engagement rate |
| The stated denominator, platform, and content context |
Share of voice |
| Competitor set, topics, markets, and sentiment drivers |
Theme frequency |
| Theme definition, independent sources, and severity |
Action rate |
| Owner, response time, review date, and later signal change |
A metric becomes useful when another person can reproduce its scope, inspect the posts or reviews behind the interpretation, and see what decision followed.
The four layers of social listening measurement
Layer | What it explains | Useful metrics |
|---|---|---|
Visibility | How much public attention exists? | Mentions, reach, share of voice |
Response | How strongly are people reacting? | Comments, shares, engagement rate, high-impact posts |
Interpretation | What is driving the conversation? | Platform sentiment, recurring themes, source concentration, customer language |
Action | What changed inside the business? | Owner, decision status, review date, time to response, signal outcome |
The layers should be read in order. Visibility establishes scale. Response shows intensity. Interpretation explains the drivers. Action records what the team did with the evidence.
Nine social listening metrics worth tracking
1. Mention volume
Mention volume counts how often a brand, product, campaign, or tracked topic appears during a defined period.
Use it to detect changes and compare periods with the same collection rules. A spike is an investigation prompt. It may come from a campaign, a viral complaint, media coverage, a product launch, or a temporary event.
Main limitation: volume does not explain the cause, source distribution, or business impact.
2. Reach
Reach estimates how many people could have encountered the tracked content. It helps separate a widely distributed conversation from a high-volume discussion inside a smaller community.
Reach definitions vary across platforms and vendors. Record whether the metric represents estimated potential reach, account audience, impressions, or another calculation. Comparisons are most useful when the definition remains stable.
Main limitation: potential exposure does not prove attention, understanding, or purchase intent.
3. Share of voice
Share of voice compares a brand's tracked conversation with the selected competitor or category set.
The denominator matters. A 45% result means little unless the report names the brands, topics, sources, markets, and time window included in the comparison.
Main limitation: high visibility can coexist with trust pressure or weak buyer confidence.
4. Engagement and engagement rate
Comments, shares, likes, saves, and replies show how people respond to content. Engagement rate provides a normalized view, but platforms and tools may calculate it differently.
Keep the numerator and denominator with the metric. A rate based on reach should not be compared casually with one based on followers or impressions.
Main limitation: engagement can represent enthusiasm, controversy, customer support demand, or repeated objections.
5. Sentiment distribution by platform
Overall sentiment can hide where positive and negative reactions occur. Split sentiment by platform, source type, market, product, or customer stage when the sample supports it.
Platform context is especially useful. Discovery-led channels may carry excitement while forums, reviews, and long-form video comments surface evaluation concerns.
Main limitation: sentiment classification needs source review, especially for sarcasm, technical complaints, mixed statements, and short comments.
6. Recurring theme frequency
Theme frequency counts how often a specific need, benefit, objection, or problem appears. Examples include compatibility, durability, price, setup, design, or privacy.
This metric becomes more useful when a team keeps customer language attached to the theme and compares the same taxonomy over time.
Main limitation: an overly broad category can hide several problems, while a taxonomy that changes every week prevents trend comparison.
7. Source concentration
Source concentration shows whether a signal comes from several independent sources or one dominant item. It can be recorded as a share of theme volume contributed by the largest post, account, thread, platform, or source type.
This helps distinguish a broad pattern from a temporary amplification event. It also tells a team where to open the source material first.
Main limitation: a concentrated signal may still be important when the source is influential or the issue is severe.
See how platform share, sentiment denominators, and source traceability are applied in the Bambu Lab social listening research.
8. High-impact source posts
Track the individual posts, comments, reviews, or threads that materially shape reach, engagement, or a recurring theme. Save the source link, date, platform, relevant excerpt or summary, and the metric it affected.
This makes a dashboard explainable. Teams can see which content created the movement instead of relying on an aggregate chart.
Main limitation: high-impact items should not crowd out lower-volume patterns that recur across many sources.
9. Action and outcome metrics
Record what happens after a finding. Useful fields include owner, decision status, time to response, due date, review date, and whether the signal increased, stabilized, or declined after action.
These fields connect analysis to operations. They also reveal which reports repeatedly produce no decision, which can be a sign that the metric set or ownership model needs revision.
Main limitation: social data alone cannot prove that an action caused the later change. Note other events, campaigns, product releases, and support changes that may have influenced the signal.
An Anker snapshot shows why the layers belong together
DataScaler's published 30-day Anker public social conversation snapshot contains several useful measurement layers.
Source and boundary
- Source: DataScaler's Anker public social conversation snapshot, published May 22, 2026
- Window: the 30-day period used in the published report
- Included: public social posts, visible comments and reviews represented in the report
- Excluded: private CRM, support tickets, sales data, and owned customer records
- Boundary: a worked public-conversation example, not a complete audit or a category-wide benchmark
The visibility and response metrics were substantial:
- 41.4K brand mentions
- 56.6M total reach
- 215K comments
- 167K shares
- 45% share of voice
- 38.23% engagement rate
These figures show a brand with strong public visibility and response. They do not identify which product claims are building confidence or where objections are forming.
The interpretation layer adds that context. Positive sentiment was approximately 55% on TikTok and 53% on Instagram. Negative sentiment was approximately 30% on YouTube and 28% on Reddit.
Positive discussion repeatedly mentioned fast charging, power banks, design, portability, and reliability. Compatibility, overheating, durability, charging speed, and price appeared as recurring friction.
Read together, the metrics suggest different platform roles. Discovery-heavy platforms were generating interest. Evaluation-heavy sources carried more product questions and objections. The next measurement step is operational: assign owners, retain source links, and check whether the selected issues persist after the team responds.

How to build a social listening scorecard
Start with one decision.
Write the business question at the top of the scorecard. Examples include launch reaction, campaign response, trust risk, product friction, or competitor movement.
Choose one or two measures from each relevant layer.
More metrics do not automatically create a better report. Select the smallest group that can establish scale, explain the pattern, and support the decision.
Preserve definitions and scope.
Record the time window, platforms, markets, query rules, competitor set, metric definitions, and exclusions. This makes later comparisons defensible.
Link interpretation metrics to sources.
Every recurring theme or platform conclusion should point to the posts, comments, or reviews behind it. Source links also help teams spot classification errors.
Add an action column.
Include owner, next step, due date, and review date beside the signal. This gives the team a place to record what happened after the report.

Metrics to use for common business questions
Business question | Start with | Add context from |
|---|---|---|
Did the campaign create attention? | Mentions, reach, engagement | High-impact posts, theme mix, platform distribution |
Why are buyers hesitating? | Recurring friction themes | Source concentration, platform sentiment, customer language |
Is a product issue growing? | Theme frequency over time | Independent sources, severity, affected products or markets |
How are we positioned against competitors? | Share of voice | Theme ownership, platform roles, positive and negative drivers |
Did the team respond effectively? | Action status, time to response | Signal trend, source follow-up, other concurrent events |
How DataScaler supports social listening measurement
DataScaler brings public social and review signals into a concise report, separates recurring themes, and keeps source references attached to the findings. Teams can move from topline activity to platform context and customer language, then inspect the original posts before assigning work. The Social Listening solution shows how this workflow connects metrics to customer language and source evidence; Brand Monitoring covers the earlier detection layer.
The Voice of Customer analysis guide explains how to prioritize and route recurring feedback. The customer intelligence platform guide shows how dashboards, evidence, and action fit together. The brand intelligence comparison places measurement in the wider decision process. Data and AI-accuracy questions are covered in the product FAQ.
FAQ
What are the most important social listening metrics?
For most teams, start with mentions, reach or share of voice, engagement, platform-level sentiment, recurring themes, source concentration, and action status. Remove any metric that does not help answer the current business question.
How do you measure social listening?
Define one business question and a fixed scope, then combine visibility, response, interpretation, and action metrics. Record each formula and denominator, keep source examples behind recurring themes, and compare periods only when the query, platforms, markets, and time windows remain compatible.
Is sentiment a reliable social listening metric?
Sentiment is useful as a directional measure when the classification is reviewed and the data scope is clear. Split it by platform or theme and inspect source examples before using it for a high-impact decision.
How should share of voice be calculated?
Define the tracked brand set, topics, sources, markets, and time window. Then compare each brand's eligible mentions with the total eligible mentions in that defined set. Keep the denominator stable when comparing periods.
What is the difference between reach and engagement?
Reach estimates potential exposure. Engagement records a response such as a comment, share, like, save, or reply. Neither metric alone explains the reason for the response.
How often should social listening metrics be reviewed?
Fast campaigns and incidents may need daily review. Launches often benefit from weekly checks. Brand and product scorecards can use monthly or quarterly cycles. Use the same scope and definitions when comparing periods.
Measure the conversation all the way to action
Enter your brand to generate a free DataScaler report. Review visibility, platform differences, recurring customer themes, and the public sources behind each finding.
Metrics become useful when they are placed inside a decision record. Use the social listening report template to connect scope, denominators, source evidence, owners, and review dates.