
Competitor benchmarking means comparing brands under the same peer set, time window, sources, sample unit, and calculation method. The point is not to produce a ranking. It is to find the relative difference that deserves investigation.
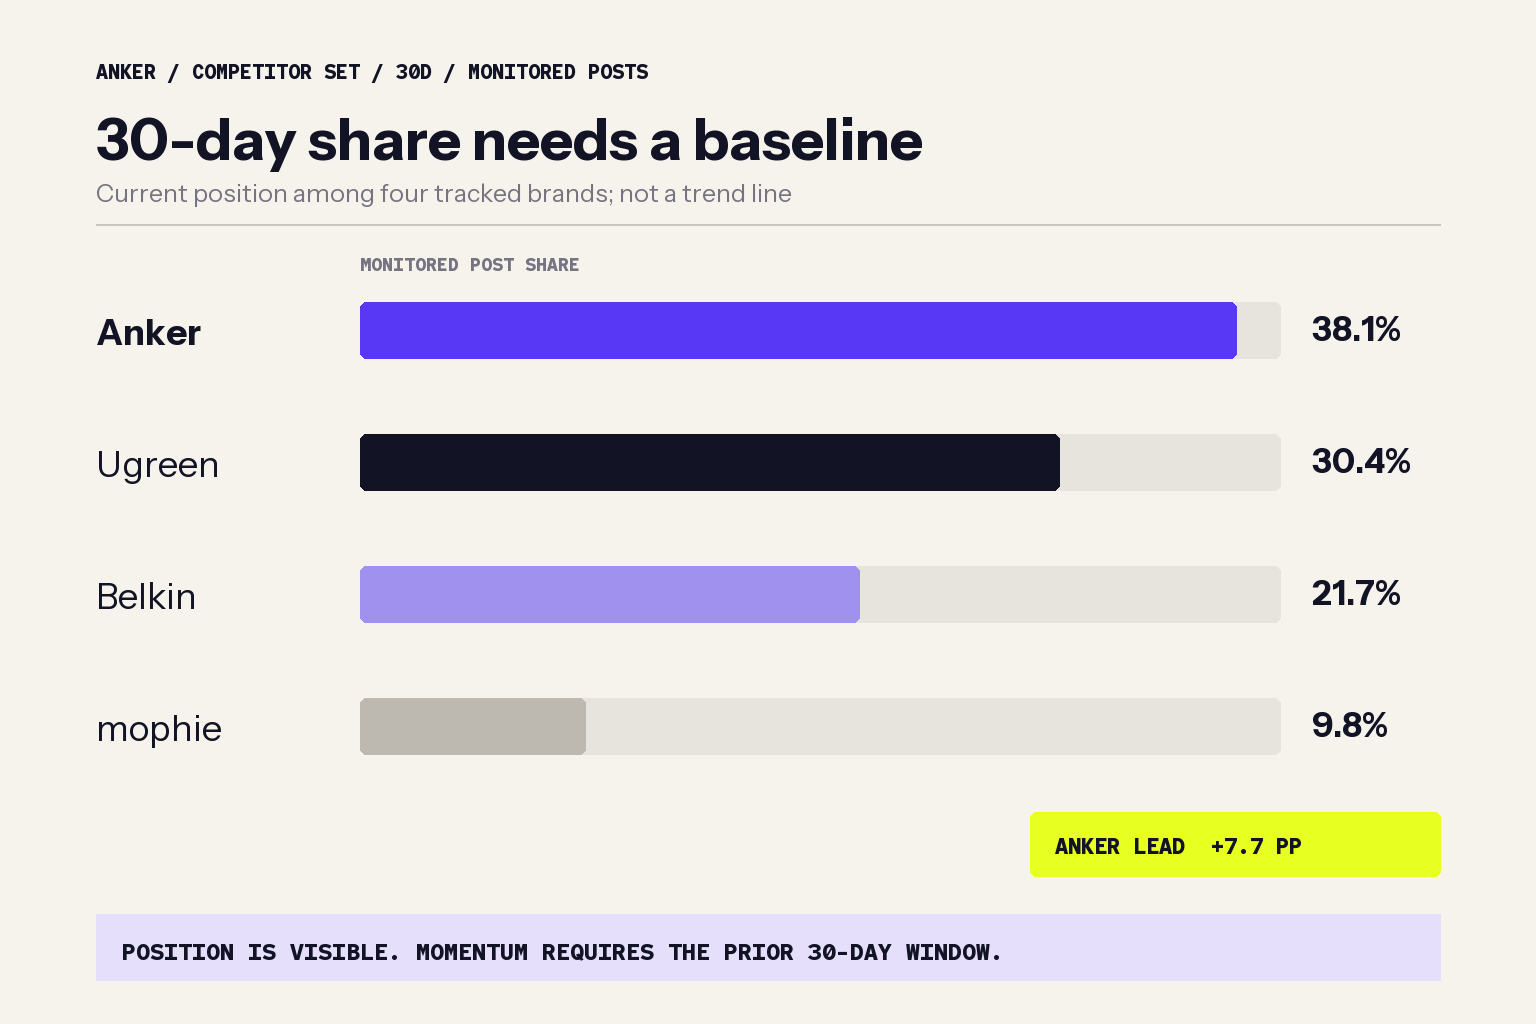
The Anker dashboard in DataScaler supports a sharper conclusion than “Anker has more conversation.” In the latest 30-day view, Anker leads a four-brand set with 38.1% of monitored posts, 7.7 percentage points ahead of Ugreen. But almost 95% of Anker’s displayed 30-day reach comes from only 46 YouTube posts, while Reddit accounts for roughly 60% of the one-year negative-exposure index derived from the platform panel.
That combination changes the diagnosis: Anker’s immediate challenge is not awareness. It is turning concentrated, often neutral visibility into product proof while resolving trust friction where it is densest.
Executive conclusion: five findings that change the action
Finding | Evidence | Conclusion | Decision |
|---|---|---|---|
Anker leads current monitored attention | 1,065 of 2,793 posts; 38.1% share versus Ugreen at 30.4% | The lead is real inside this configured 30-day set, but it is not proof of market leadership | Investigate the 216-post gap with Ugreen before expanding the peer set |
Reach is highly concentrated | 46 YouTube posts generate 95.0% of displayed 30-day reach | Topline reach is being set by a small number of high-reach sources | Separate visibility from consideration and source quality |
The largest reach channel is not the strongest advocacy channel | YouTube is 39% positive and 54% neutral in the 30-day summary, versus 56% positive overall | Broad exposure is not converting into equally strong endorsement | Use source-backed comparison and compatibility proof after high-reach content |
Risk is concentrated on Reddit | 23.3% of annual mentions, but about 60.5% of the derived negative-exposure index | Aggregate sentiment understates the platform where objections accumulate | Audit Reddit by product, issue, and ownership stage |
The core promise and the core friction overlap | Fast charging leads positive themes; charging speed, compatibility, overheating, and price recur negatively | The winning claim raises the expectation that creates the complaint | Replace generic speed claims with model- and protocol-specific evidence |
These are decision hypotheses, not final claims about Anker customers. The platform data comes from public conversation, and every important conclusion still needs source-level review.
1. Anker leads the current set—but the dashboard does not prove momentum
From August 16 through September 15, 2026, the configured competitor view contains 2,793 monitored posts across Anker, Ugreen, Belkin, and mophie.
Brand | Monitored posts | Share | Positive share | Displayed growth |
|---|---|---|---|---|
Anker | 1,065 | 38.1% | 56% | Not shown in the comparison summary |
Ugreen | 849 | 30.4% | 48% | -66.2% |
Belkin | 606 | 21.7% | 49% | -62.2% |
mophie | 273 | 9.8% | 44% | -73.6% |
Anker has 216 more monitored posts than Ugreen and an eight-point advantage in positive share. Those are useful current-position signals. They do not prove that Anker is gaining momentum.
The reason is visible in the final column. All three peers show steep negative growth, while Anker’s comparable growth figure is not displayed in the summary. A share lead can widen because the leader is growing, because competitors are shrinking, or because the monitored source mix changed. The table cannot tell us which explanation is true.
The first internal question should therefore be: what produced the 216-post lead over Ugreen, and did Anker’s own absolute conversation grow against the preceding 30-day window? Until that is answered, “Anker leads this monitored set” is defensible; “Anker is gaining category momentum” is not.
2. Ninety-five percent of reach comes from 4.3% of posts
The 30-day Anker summary displays 1,065 posts, 4,446 post-and-comment mentions, 1,733,017 in reach, and an overall sentiment mix of 56% positive, 39% neutral, and 5% negative.
YouTube looks very different:
- 46 posts, or 4.3% of the 1,065-post base;
- 585 mentions, or 13.2% of the 4,446 post-and-comment mentions;
- 1,645,749 in reach, or 95.0% of displayed reach;
- 39% positive, 54% neutral, and 7% negative;
- 1.6% displayed engagement, compared with 28.8% in the overall summary.
This is not a small channel effect. It means the reach number is effectively a YouTube number, even though YouTube represents only a small share of parent posts. It also means the channel producing the broadest exposure is substantially more neutral than the overall conversation.

The one-year source list reinforces the concentration risk. Three visible high-reach records—an Anker Solix promotion on X, a YouTube power-bank item, and the TikTok post “World’s Longest Phone Charger”—show 38.6M, 28.6M, and 25.6M respectively. Together they represent 92.8M, roughly 30% of the 310M annual reach displayed by the dashboard. A few promotional or viral records can therefore move the reach headline without creating an equally broad product preference signal.
The strategic implication is straightforward: Anker does not need to treat more reach as the next objective. It needs a handoff from reach to proof. High-reach YouTube and TikTok content should lead into product-level comparisons, charging-protocol compatibility, tested performance, and source-backed ownership evidence. Otherwise the dashboard can show enormous visibility while purchase questions remain unresolved.
3. Reddit is the risk center, even though YouTube is the volume leader
The one-year baseline covers September 15, 2025 through September 15, 2026 and totals 149.7K displayed mentions. YouTube contributes 44.0% of that volume; Reddit contributes 23.3%.
Volume alone would put YouTube first in every review queue. Negative density reverses the priority.
Platform | Mentions | Volume share | Negative share | Derived negative-exposure index | Share of index |
|---|---|---|---|---|---|
34.9K | 23.3% | 24% | ≈8.4K | ≈60.5% | |
YouTube | 65.9K | 44.0% | 6% | ≈4.0K | ≈28.6% |
4.6K | 3.1% | 12% | ≈552 | ≈4.0% | |
TikTok | 25.3K | 16.9% | 2% | ≈506 | ≈3.7% |
15.7K | 10.5% | 2% | ≈314 | ≈2.3% | |
Other displayed platforms | 3.3K | 2.2% | 1%–23% | ≈146 | ≈1.1% |
The negative-exposure index multiplies each displayed platform count by its rounded negative percentage. It is an approximate triage metric, not an exact count of negative posts or people.
Even with that limitation, the difference is too large to ignore. Reddit has roughly half of YouTube’s annual mention volume, four times its negative rate, and more than twice its estimated negative-classified exposure. About three in five units in the derived risk index come from Reddit.
The latest 30-day Reddit summary is less negative than the annual view—17% versus 24%—but it still has the highest displayed negative pressure in the current report. That may be an early improvement, a temporary source-mix change, or ordinary variation. The screenshot also notes that no evaluation-level negative sample was available to cite in that summary. So the correct action is not to declare the problem solved. It is to inspect the Reddit records behind price, reliability, durability, compatibility, overheating, and charging-speed discussions.

4. Fast charging is both the growth promise and the expectation risk
The annual theme panel includes 12,580 posts with completed sentiment analysis. Its top terms do more than list what people discussed; they reveal where product positioning and customer friction collide.
Theme | Positive occurrences | Negative occurrences | What the split suggests | Question to investigate |
|---|---|---|---|---|
Fast charging / charging speed | 1,028 for “fast charging” | 376 for “charging speed” | Speed is a major reason to notice Anker and a recurring way expectations fail | Which device, cable, protocol, wattage, and charging condition were involved? |
Price | 431 | 508 | Negative occurrences exceed positive ones; the issue is more likely an unresolved value comparison than a simple awareness gap | Which competitor, bundle, capacity, warranty, or ownership cost defined “expensive”? |
Durability | 533 | 386 | Evidence is polarized rather than uniformly negative | Does the split follow product family, ownership duration, or platform? |
Reliability | 520 | 248 | There is substantial positive proof and a meaningful trust tax | Are the negative records reproducible issues or isolated contexts? |
Compatibility / overheating | Not in the positive top ten | 314 / 303 | These are narrower but decision-critical objections | Which models and use conditions create repeatable friction? |
Counts can overlap and do not represent unique customers. They should not be subtracted into a fake “net issue score.” Their value is in showing what must be segmented.
The deepest finding is the charging tension. Anker’s strongest positive phrase and a major negative phrase describe the same customer job: charging quickly and predictably. The benefit claim is doing its job—it attracts attention—but it also creates a precise expectation. When the device, cable, protocol, temperature, or power profile does not match that expectation, the same category becomes a complaint.
Price follows a different pattern. It is the clearest matched theme where negative occurrences exceed positive ones. That does not prove that Anker is overpriced. It says the current evidence needs a better value denominator: price per capacity, ports, supported protocols, warranty, durability, or ownership period. A generic “premium quality” answer will not resolve a comparison that customers are already making at product level.
“Anker problems,” the largest negative label at 840 occurrences, is too broad to become a product ticket. It should be decomposed into product, issue, ownership stage, platform, and severity before anyone uses it in an executive report.

5. What a brand team should do with this benchmark
If this were an internal Anker review, the report should not end with “monitor the conversation.” It should create a short, owned work queue.
Priority | Owner | Action | Evidence required | Success signal |
|---|---|---|---|---|
P0 | Consumer insights | Audit the 20 highest-engagement Reddit sources across price, reliability, durability, compatibility, overheating, and charging speed | Product, exact wording, purchase/ownership stage, severity, and source URL | A source-linked issue map instead of one aggregate negative score |
P0 | Competitive intelligence | Explain the 216-post gap between Anker and Ugreen using the same 30-day window | Platform, product line, content format, reach source, and sentiment denominator | A defensible answer to whether the gap is launch-, channel-, or product-driven |
P1 | Product marketing | Build model-specific charging proof rather than a generic “fast” claim | Protocol, compatible devices, cable, rated and observed wattage, conditions, and limitations | More source-backed comparison visits and fewer ambiguous speed objections |
P1 | Content / SEO | Create compatibility and value pages around the language customers already use | Verified source wording for price, compatibility, overheating, and charging speed | Qualified visits to product comparison and support pages |
P1 | Support / product | Separate durable product issues from setup or protocol mismatch | Repeatability, affected model, environment, resolution, and recurrence | Fewer unresolved cases grouped under broad labels such as “Anker problems” |
For the next benchmark, keep the peer set and tracked terms fixed. Compare Anker’s absolute posts, post-and-comment mentions, and platform mix against the preceding 30 days before interpreting share changes. A growing share with falling absolute conversation is not the same as true momentum.
This is the bridge from competitor monitoring to competitive intelligence analysis: monitoring finds the difference; analysis tests the explanation; the source record determines whether the team should act.
Method, limitations, and FAQ
How the derived figures were calculated
- Share of monitored posts equals each brand’s displayed 30-day post count divided by 2,793.
- YouTube concentration uses 46 of 1,065 posts, 585 of 4,446 mentions, and 1,645,749 of 1,733,017 displayed reach.
- Annual platform share uses the displayed platform totals, which sum to 149,737 because the dashboard rounds most values to one decimal thousand.
- The negative-exposure index multiplies displayed mentions by the rounded negative percentage. It is useful for prioritization, not publication as an audited count.
What this analysis cannot prove
Public posts, visible comments, communities, and reviews do not represent every customer. Automated sentiment can miss sarcasm, mixed statements, and context. Theme counts can overlap. Reach is a platform estimate, not verified attention. The data cannot establish revenue impact, category market share, product quality, or causality.
The one-year baseline covers September 15, 2025 through September 15, 2026. The competitor comparison and 30-day summary cover August 16 through September 15, 2026. They are used for different questions and are not combined into one performance score.
What is competitive benchmarking?
Competitive benchmarking is the repeated comparison of brands under a fixed peer set, time window, source coverage, sample unit, and metric definition. A trustworthy benchmark shows both the difference and the denominator behind it.
How do you benchmark competitors?
Freeze the brands, tracked terms, platforms, window, and units. Compare absolute volume and share, inspect the sources behind the largest differences, separate platform mix from product sentiment, and assign only evidence-backed findings to an owner.
Run the same analysis for your brand
Preview your brand in DataScaler to identify a competitor set, inspect changes across public platforms, and open the source content behind each finding. DataScaler’s brand monitoring workflow keeps volume, recurring objections, competitor movement, and source evidence in one report.
Data source
All Anker figures were transcribed or derived from the DataScaler dashboard screenshot captured on September 15, 2026. Bambu Lab is not included in the numerical ranking; its fixed social listening research remains a separate example of platform-concentration and source-quality controls.