
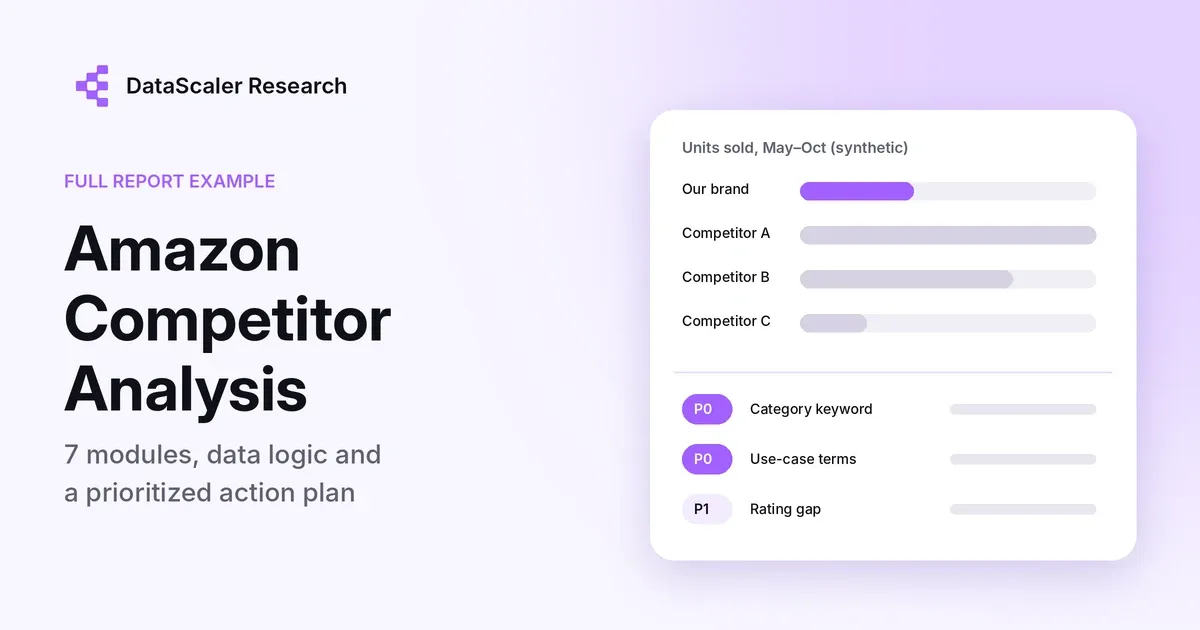
Quick answer: A useful Amazon competitor analysis compares your brand with two or three direct rivals on seven things: product setup, sales and price, search demand, category keyword rankings, untapped search terms, social conversation and a final list of prioritized actions. Each finding should point back to the data behind it, and each action should say how you will know it worked.
Most guides list the steps. This one shows the finished report, the kind a brand team or Amazon seller can put in front of a manager. Below is a complete example for a fictional brand in a consumer electronics category, laid out module by module, with the data logic behind each section and the conclusions it supports.
About the numbers: every figure in this example is synthetic. The brands are anonymized as "Our brand" and Competitors A, B and C, and the data was generated to demonstrate structure and method. It follows the layout of the competitor reports DataScaler prepares for brand teams, but it describes no real company, product or marketplace. Do not use these numbers as market data.
The Amazon competitor analysis report example at a glance
- Category: pocket vlogging cameras on a single Amazon marketplace
- Brands compared: Our brand (the subject) and Competitors A, B and C
- Window: May to October 2026; October covers 17 days only
- Context: Our brand and Competitor A both launched a new generation in June 2026
A report like this should open with a short executive brief that a manager can read in one minute. In this example it says:
- Position: Competitor A leads on volume. Our brand sold about 0.4× as many units over the period but is growing fastest.
- Weakness: Our brand is strong on its own brand terms and weak on category terms. It does not rank on the first two pages for the biggest category search.
- Strengths: Our brand has more free placements on other listings' pages, the highest social engagement rate of the four, and a price that is now close to Competitor A's.
- Priorities: Win category and use-case search terms first (P0), then fix the rating gap and scale social reach (P1).
Everything after the brief exists to prove those four lines.
Module 0: Product setup
Start by mapping every live listing for each brand. Brands often sell the same product through several listings, bundles or resellers, and a report that only counts the parent ASIN will undercount sales.
Metric (synthetic) | Our brand | Competitor A | Competitor B | Competitor C |
|---|---|---|---|---|
Live listings | 6 separate listings | 1 parent ASIN (5 variations) + 1 separate | 3 separate | 2 separate |
Price range | $749–$949 | $769–$880 | $599–$699 | $399–$499 |
Rating / reviews | 4.2★ / 80 | 4.4★ / 127 | 4.3★ / 2,100 | 4.1★ / 540 |
Best BSR | #3,699 | #1,098 | #2,400 | #8,500 |
Fulfillment | FBM, several resellers | FBA (brand) + 1 third party | FBA | FBM |
Data logic: collect each brand's listings from its storefront and category filters, not from a keyword search, which misses listings that do not rank. Pull title, price, variations, rating, review count, BSR, fulfillment and seller count for each one.
What it tells you: Our brand's 80 reviews are a small base. At that size, each negative review moves the average more, which matters for Module 6.
Module 1: Sales and price
This module answers the question every manager asks first: who is selling more, and is the gap closing?
Metric (synthetic) | Our brand | Competitor A | Competitor B | Competitor C |
|---|---|---|---|---|
Units sold, May–Oct | 7,228 | 18,800 | 13,500 | 4,230 |
Monthly average (Oct partial) | ~1,205 | ~3,133 | ~2,250 | ~705 |
Daily sales, Oct vs Jun | ~75 vs ~34 (+119%) | ~215 vs ~103 (+108%) | Stable | Stable |
Main model price, launch → now | $1,229 → $899 (−26.9%) | $879.99, unchanged | $649, unchanged | $449, unchanged |
Data logic: aggregate daily unit estimates for every live ASIN, then sum by month. Count a parent ASIN once to cover its variations, and add separate listings on top. Exclude last-generation products from new-generation totals, and label any partial month: here, October has only 17 days of data.
What it tells you: Our brand sells 0.4× Competitor A's volume, but it is growing faster and has closed most of the price gap, from $349 at launch to $19. Competitors B and C sit in lower price bands and are not in a direct price fight.
Module 2: Search demand and keyword structure
Sales tell you who is winning. Keyword data tells you why.
Metric (synthetic) | Our brand | Competitor A | Competitor B | Competitor C |
|---|---|---|---|---|
Ranking keywords | 321 | 72 | 210 | 60 |
Top traffic terms | Mostly brand and model terms; "compact camera" 9.5% | "camera" 34.8%, brand 28.2% | "vlogging camera" 12%, brand 20% | "budget camera" 22% |
Placements on other listings | 69 | 0 | 45 | 8 |
Data logic: for each ASIN, pull ranking keywords with organic, sponsored and related-traffic splits and the share of traffic from each top term. Check flagship brand-term search trends from Amazon's search query data where you have access. "Placements on other listings" counts how many other product pages show the brand's ASIN in recommendation slots such as "Frequently bought together" or "Customers also viewed".
What it tells you: Our brand ranks for more than four times as many keywords as Competitor A, yet most of its traffic comes from people already searching for it by name. Their top traffic terms barely overlap, so they mostly reach different shoppers. Competitor A's broad "camera" traffic is the audience Our brand is missing.
Module 3: Category keyword rankings
This is where the main gap usually shows. List the category's biggest search terms and check where each brand ranks, organic and sponsored, on the first two pages.
Category keyword | Monthly searches (synthetic) | Our brand | Competitor A | Competitor B | Competitor C |
|---|---|---|---|---|---|
vlogging camera | 116K | Not ranked | #19 | #5 | — |
camera for vlogging | 22K | #24 | #11 | #7 | — |
budget camera | 14K | — | — | #18 | #4 |
4k vlogging camera | 9K | #30 | #15 | #9 | — |
gimbal camera | 7K | #14 | #3 | #9 | #26 |
Data logic: record live positions with the capture date, and separate organic from sponsored. "Not ranked" means the main ASIN is not on the first two pages. Note when an older generation of the same product holds the position. The table shows organic ranks; "—" means the term was not tracked for that brand because it sits outside its price band.
What it tells you: the category's largest entry point, "vlogging camera," is held by Competitors B and A. Our brand is absent. That single gap explains much of the sales difference in Module 1.
Module 4: Search terms nobody owns yet
Category keywords are contested. The next question is where demand exists that no brand has claimed. The example finds it by working backward from how buyers talk about the product off Amazon.
Use-case search term | Where the idea came from | Our brand's rank | Suggested test |
|---|---|---|---|
travel vlogging camera | Travel creators on YouTube and TikTok | Not ranked | P0: sponsored ads plus a travel-focused A+ module |
handheld gimbal for TikTok | Vertical short-video creators | #14 | P1: PPC test |
real estate walkthrough camera | Agents filming property tours | Not ranked | P0: content and ads |
better than phone for vlog | "Why not just use my phone?" discussions | Not ranked | P0: comparison content |
Data logic: pull Our brand's non-branded ranking terms, then map recurring use cases from social conversation to search terms and check purchase intent.
What it tells you: these terms do not overlap with the contested category keywords, and competitors barely cover them. Treat them as a hypothesis, not a sure win: test with sponsored ads before rewriting the listing, and do not call them "zero competition" until the test is in.
Module 5: Social conversation
Amazon data shows what happens on the listing. Social data shows what shapes the decision before a shopper arrives.
Last 30 days (synthetic) | Our brand | Competitor A | Competitor B | Competitor C |
|---|---|---|---|---|
Posts / reach | 74 / 980K | 51 / 720K | 103 / 1.68M | 29 / 360K |
Engagement rate | 15.0% | 12.5% | 10.0% | 14.0% |
Sentiment (pos / neutral / neg) | 45 / 47 / 8 | 55 / 38 / 7 | 48 / 45 / 7 | 40 / 50 / 10 |
Top risk terms | "Competitor A," "previous gen," "overheating," "battery" | "Our brand," "previous gen" | "new model replaces" | "quality" |
Data logic: pull each brand's public posts and comments across platforms for the same window, then compare volume, reach, engagement, sentiment, channels and the most frequent positive and negative terms. Keep post-level and comment-level negatives apart: a negative comment under a positive review is not the same signal as a negative review.
What it tells you: Our brand has the most engaged audience but less than 60% of Competitor B's reach. About three quarters of its reach comes from long YouTube reviews, while TikTok contributes roughly 130K. Its most frequent risk terms are comparisons with Competitor A and the previous generation, plus overheating and battery life. High engagement is not the same as high conversion, so the report keeps the two apart.
If you want to see how this module looks with real public data, our Anker competitor benchmark and the Bambu Lab sample report use real posts.
Module 6: Opportunities, evidence and priorities
The last module turns everything above into one decision table. Every row must point back to a module, and every action needs a way to check it worked.
Opportunity | Evidence | Priority | Action | How to verify |
|---|---|---|---|---|
Use-case search terms | Modules 2 and 4: only one non-brand term ("compact camera") above 5% of traffic; use-case terms unclaimed | P0 | Sponsored ads and use-case A+ content; expand the listing only after conversion is proven | Organic rank, ad impressions, click-through, conversion |
Category keyword | Module 3: not ranked for "vlogging camera"; Competitors B and A hold #5 and #19 | P0 | Sponsored ads plus comparison content against phones | Rank change, ACoS, conversion |
Rating gap | Module 0: 4.2★ from 80 reviews vs 4.4★ from 127; Module 5: overheating and battery complaints | P1 | Trace recent negative reviews to root causes; publish heat and battery guidance; use only Amazon's own review programs, such as Amazon Vine | Rating, share of negative themes |
Social reach | Module 5: highest engagement, lower reach, weak on TikTok | P1 | Cut YouTube comparison reviews into vertical videos; build a comparison series | Reach, engagement rate, output per week |
What it tells you: the core problem is "strong brand terms, weak category terms." Our brand has the keyword count but not the category traffic, which explains much of why it sells 0.4× Competitor A's volume. The two P0 items address that directly.
Five rules that make a competitor report trustworthy
The structure above matters less than the habits behind it. These are the five that separate a report people act on from one they file:
- Show the data logic for every module. Say where the numbers came from, which fields were used and how they were added up. It is what lets a skeptical reader check the work.
- Tie every recommendation to evidence. "Module 3: not ranked for the top category keyword" is an argument. "Improve SEO" is not.
- Label partial and missing data. If a month has 17 days, say so. If conversion data is not available, write "not available" instead of estimating it.
- Keep different signals apart. Engagement is not conversion. A comment is not a post. A search-term idea is not a proven opportunity.
- Count every listing. Separate listings, bundles and reseller ASINs all carry sales. Missing them makes a competitor look smaller or larger than it is.
Amazon competitor analysis template: copy this outline
Use this as the skeleton for your own Amazon competitor analysis:
Module | Key question | Core fields |
|---|---|---|
Executive brief | What should we do first? | Position, main weakness, main strength, top priorities |
0. Product setup | What exactly are we comparing? | Listings, variations, price range, rating, reviews, BSR, fulfillment |
1. Sales and price | Who sells more, and is the gap closing? | Units by month, daily trend, price history, partial-month labels |
2. Search demand | Why does each brand get traffic? | Ranking keywords, top terms and shares, placements on other listings |
3. Category keywords | Who owns the biggest searches? | Monthly searches, organic and sponsored rank by brand, capture date |
4. Untapped terms | Where is demand nobody owns? | Use cases from social, mapped search terms, current rank, test plan |
5. Social conversation | What shapes the decision before Amazon? | Posts, reach, engagement, sentiment, channels, risk terms |
6. Opportunities | What do we do, and how do we know it worked? | Opportunity, evidence by module, priority, action, verification metric |
For the earlier steps of choosing rivals and the wider framework beyond Amazon, see how to identify direct competitors and our ecommerce competitor analysis framework. To keep the analysis current between full reports, a weekly competitor monitoring routine covers the essentials.
Want this report for your brand? DataScaler can build it with your real listings and competitors. Book a demo, or start with a free brand report on the social side.
FAQ
What should an Amazon competitor analysis include?
At minimum: each competitor's listings and prices, sales estimates over time, the keywords that drive their traffic, where they rank for your category's biggest searches, what buyers say about them in reviews and on social media, and a prioritized list of actions tied to that evidence.
How many competitors should I analyze on Amazon?
Two or three direct competitors is usually enough: the listings buyers most often compare with yours. More than that spreads the analysis thin. Add a fourth only if it holds a position you want, such as the top rank for a key category search.
How do I estimate a competitor's Amazon sales?
Third-party tools estimate unit sales from Best Seller Rank history and category data. Treat the results as estimates, compare trends rather than exact numbers, and count every live listing, including bundles and reseller ASINs.
What tools do I need for Amazon competitor analysis?
Usually a mix. Seller tools such as Helium 10, Jungle Scout or Keepa cover sales estimates, BSR and price history, and keyword ranks. Amazon Brand Analytics, available to brand-registered sellers, adds search query data. Off-Amazon conversation needs a social listening tool; DataScaler covers that side, from posts and comments to sentiment and risk terms.
How often should I run an Amazon competitor analysis?
A full report every quarter, or after a major launch or price change in your category. Between reports, a lighter weekly check of prices, ranks and new reviews catches most changes.
Is this example based on real data?
No. Every number in this example is synthetic and the brands are anonymized. It shows the structure and method of a real report, not the results of one.
Notes
All brands, products and figures in this example are synthetic and anonymized, generated to demonstrate the report structure and data logic. They do not represent any real company, product, marketplace or result. The example was prepared on October 28, 2026.
Want to see how your brand compares? Book a demo to get this report built on your real data, or generate a free brand report to start.